Operational Capacity Units (OCU)
OCU is a normalized metric that answers “how many jets can I fit?” 1 OCU = 1 Challenger 300 parking footprint (4,400 ft²).
OCU must be enabled before it appears. Go to Settings → Configuration → Display and turn on “Display Operational Capacity (OCU)”. See Configuration settings for details.
What is an OCU?
Square footage utilization percentages are hard to reason about — hearing “your ramp is at 62% utilization” doesn’t immediately tell an operator whether there’s room for a Global 7500.
OCU solves this by defining a unit sized to a familiar mid-cabin jet: the Challenger 300 (4,400 ft²). Think of it like measuring parking lots in “car lengths” — operators instantly know a Global 7500 takes 2.6× the space of a Challenger 300.
Common Aircraft OCU Values
| Aircraft | Wingspan | Length | Footprint | OCU |
|---|---|---|---|---|
| CJ3 | 53.3 ft | 41.2 ft | 2,196 ft² | 0.5 |
| Phenom 300 | 52.2 ft | 51.2 ft | 2,673 ft² | 0.6 |
| Challenger 300 | 63.9 ft | 68.8 ft | 4,396 ft² | 1.0 |
| Citation Latitude | 72.3 ft | 62.1 ft | 4,490 ft² | 1.0 |
| Gulfstream G280 | 63.1 ft | 66.8 ft | 4,215 ft² | 1.0 |
| Legacy 500 | 66.5 ft | 68.2 ft | 4,535 ft² | 1.0 |
| Challenger 650 | 68.5 ft | 68.4 ft | 4,685 ft² | 1.1 |
| Gulfstream G550 | 93.5 ft | 96.4 ft | 9,013 ft² | 2.0 |
| Global 7500 | 104 ft | 111 ft | 11,544 ft² | 2.6 |
OCU is calculated as (wingspan × length) / 4,400. Every aircraft in the registry gets an OCU badge automatically — check the aircraft list on any ramp.
![]() Each aircraft shows its OCU value as a badge in the aircraft list.
Each aircraft shows its OCU value as a badge in the aircraft list.
Reading the Capacity Bar
You’ll find the capacity bar in the Ramp Info Card (left sidebar when viewing a ramp).
 The segmented capacity bar shows current load vs. operational capacity with color-coded zones.
Color Zones
The capacity bar is divided into three segments, each representing a utilization range:
- Green segment (0–70%): Comfortable — plenty of room for new arrivals
- Yellow segment (70–90%): Busy — plan carefully for additional aircraft
- Red segment (over 90%): At capacity — limited room, consider overflow options
Each segment fills proportionally as utilization increases. A pointer arrow below the bar marks the exact current utilization level.
Load vs Capacity
- Load — sum of OCU for all aircraft currently on the ramp
- Operational Capacity — how many OCU the ramp can realistically hold. Defaults to 55% of max theoretical density, accounting for taxi lanes, wingtip clearance, and equipment staging areas. Can be customized per ramp — click the edit icon (pencil) next to the capacity value to open the override popover and set a custom value. When a custom override is active, a reset icon (circular arrow) appears, allowing you to revert to the calculated default with one click.
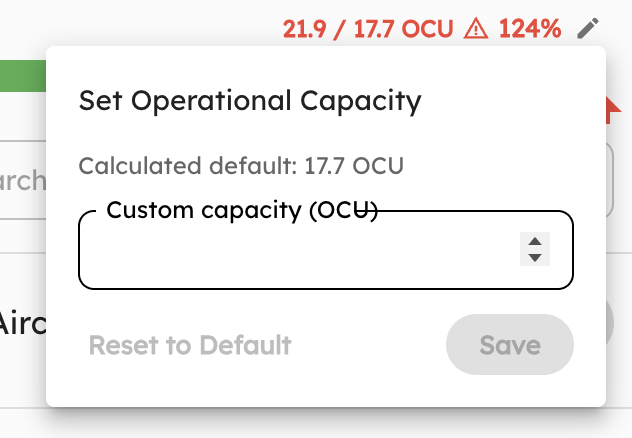 Set a custom operational capacity from the Ramp Info Card.
Over Capacity
When load exceeds operational capacity, the bar fills all three segments and the percentage turns red with a warning icon. The pointer arrow clamps at 100%, but the displayed percentage reflects the true utilization.
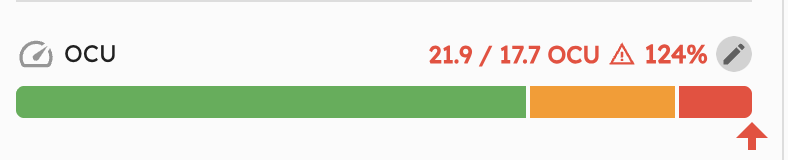 At 124% utilization, the warning icon and red text signal the ramp is overloaded.
Tooltip Details
Hover over the capacity bar or the OCU label to see a detailed tooltip summarizing the metric, color zone legend, and your ramp’s current operational capacity. The tooltip also includes a direct link back to this documentation page.
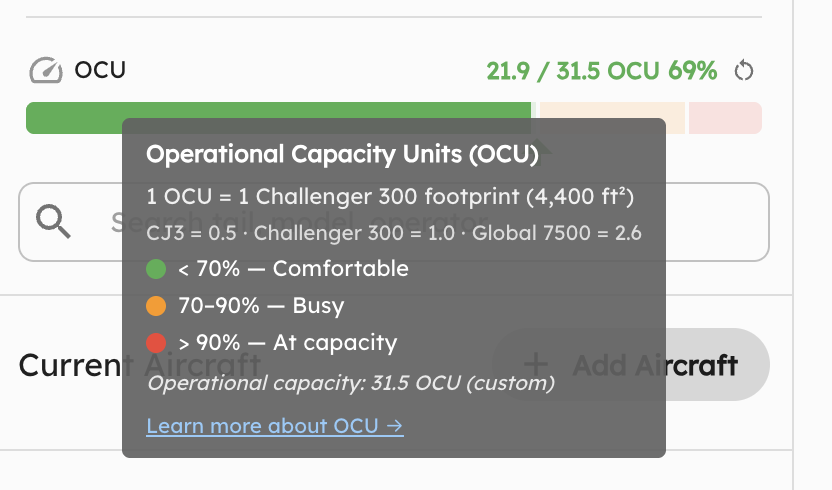 The tooltip shows zone thresholds, example aircraft values, and whether capacity is using a custom override.
Capacity Planning with OCU
Quick mental math for operators:
- Know your capacity: A 100,000 ft² ramp = 12.5 operational OCU (at default 55%)
- Estimate arrivals: 3 incoming Globals (2.6 each) = 7.8 OCU
- Check headroom: If current load is 3.2 OCU → new total 11.0 / 12.5 = 88% → yellow zone
The 0.55 Operational Factor
Max theoretical density assumes every square foot is usable. In practice, ~45% of ramp area is consumed by:
- Taxi lanes and vehicle access roads
- Wingtip-to-wingtip safety clearance
- GSE (ground support equipment) staging
- Fire lane setbacks
The 0.55 factor is our best estimate based on researching a variety of real-world ramp layouts — it’s a conservative starting point, but every ramp is different. Your actual usable percentage depends on layout, traffic patterns, and equipment needs. That’s why it’s configurable: if 0.55 doesn’t match your ramp’s real-world constraints, set a custom operational capacity from the Ramp Info Card.
Aircraft Carrier Analogy
Aircraft carriers face the same spatial puzzle as FBO ramps — maximizing aircraft density on a fixed area while maintaining operational flow.
- A Nimitz-class carrier deck: ~100,000 ft² of usable flight deck
- Typical air wing: ~44 aircraft (F/A-18, E-2C, etc.)
- Effective density: ~2,270 ft² per aircraft — roughly 0.5 OCU each
Carriers achieve this through extreme choreography (the “ballet on the flight deck”). FBO ramps operate at lower density because aircraft aren’t being repositioned every 90 seconds by a 20-person crew. The 0.55 factor captures this real-world difference.